SYDNEY, NSW – 14 Aug, 2026 – Australia’s property market is splitting along clear lines. While detached houses absorb the brunt of higher borrowing costs and stretched household budgets, units are holding up better — and in many locations actively outperforming.
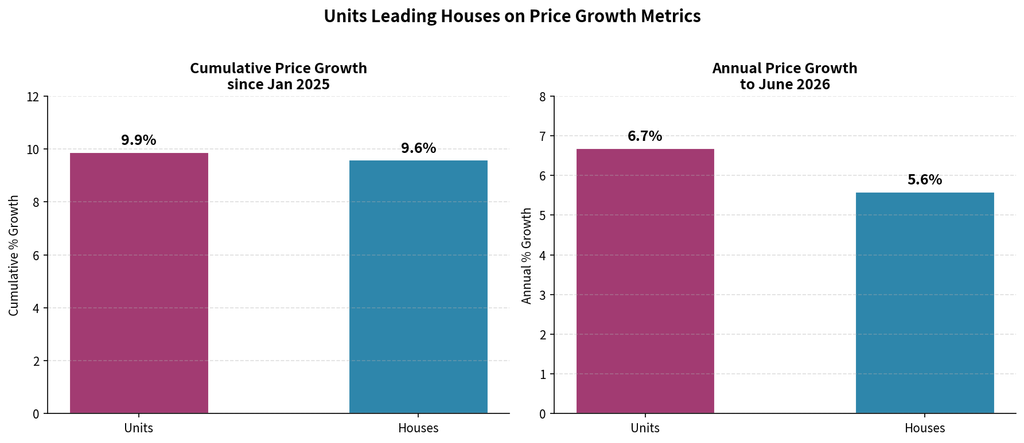
The latest PropTrack figures show the shift clearly. Over the year to June 2026, national unit values rose 6.7 per cent and were flat in the month. Houses managed 5.6 per cent annual growth but slipped 0.4 per cent in June. Cumulative gains since the start of 2025 tell the same story: units up 9.9 per cent versus 9.6 per cent for houses. By July the pattern continued — houses down 0.4 per cent for the month to a $989,000 median, units down a milder 0.2 per cent to $730,000. Annual growth had moderated but units still led (around 5.1 per cent versus 3.6 per cent for houses).
Supply is not the differentiator. New listings for both houses and units rose by roughly the same amount in the six months to June 2026 compared with a year earlier. The outperformance therefore points to demand. Search data on realestate.com.au backs this up. Unit searches as a share of total buyer activity sat below 30 per cent in late 2020, climbed into the high 30s through 2021–24, and have lifted again since late 2025.
While traditional buyer agents charge $15,000–$40,000+, We evaluate hundreds of key data points — historical sales, listings, location metrics, and land details — to give you confident, high-return buying decisions. Don’t overpay for expertise!
Unlock expert property buying advice report for FREE (real $0). Start your Buyer Brief now!
Why the switch?
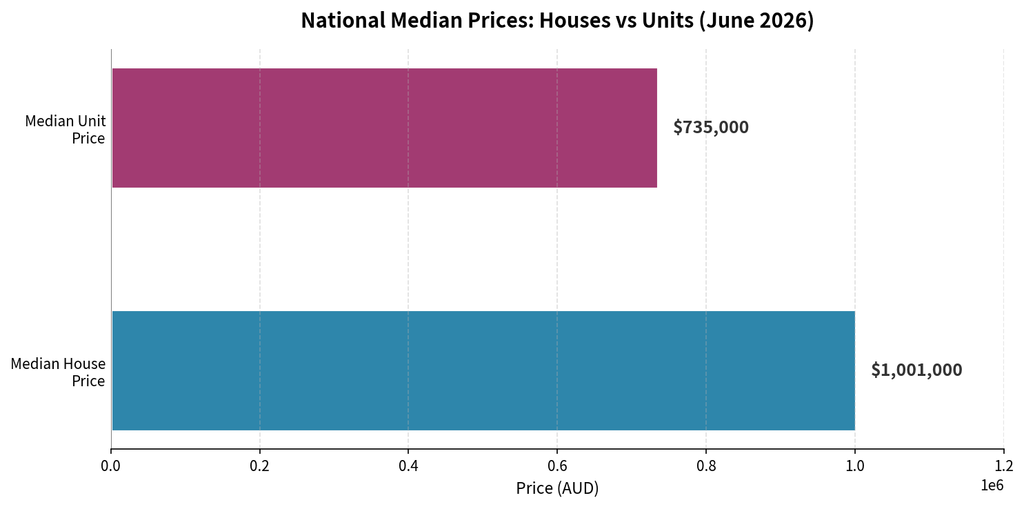
Price is the obvious driver. At a national level the median house still sits near $1 million while the typical unit is around $730,000–$735,000 — a gap of more than a quarter of a million dollars.
PropTrack’s 2025 Housing Affordability report found the median household could service a loan on only 15 per cent of properties. With interest rates higher and cost-of-living pressures still elevated, a growing cohort of buyers is simply priced out of the freestanding market and is redirecting toward apartments, townhouses and units.
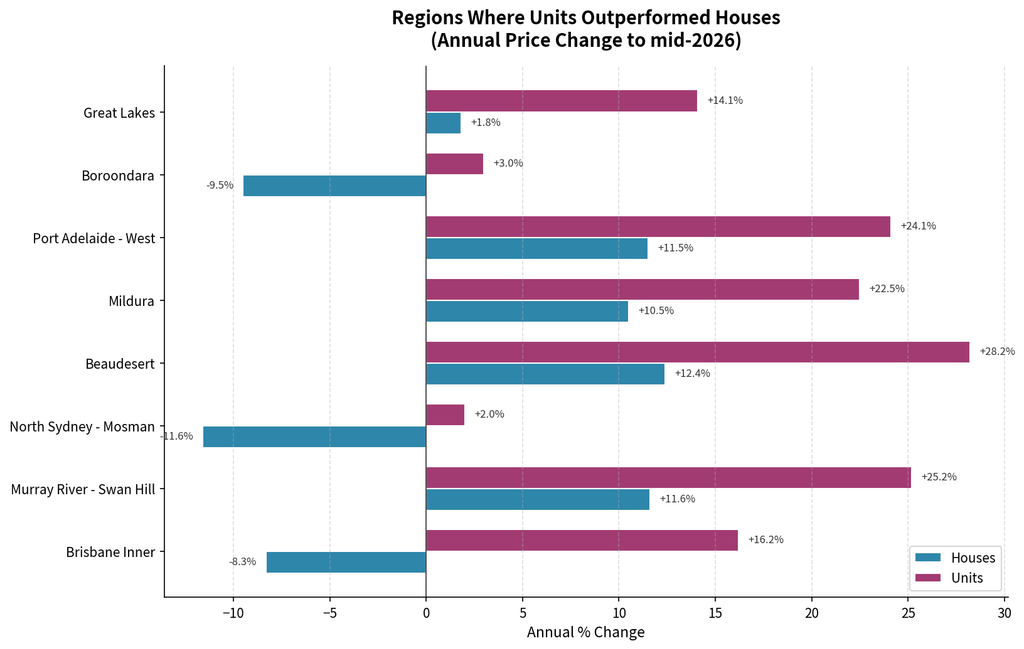
This is not a uniform national trend. The gap between unit and house performance is widest in certain high-cost or rapidly changing SA3 regions. The chart below highlights a selection of those locations where units delivered clearly stronger annual growth.
Key stand-outs include:
- Greater Brisbane: Brisbane Inner (units +16.2 % vs houses –8.3 %), Brisbane Inner–West (+21.5 % vs +5.3 %), Beaudesert (+28.2 % vs +12.4 %).
- Victoria: Murray River–Swan Hill (+25.2 % vs +11.6 %), Mildura (+22.5 % vs +10.5 %), Boroondara (+3.0 % vs –9.5 %).
- Greater Sydney & Rest of NSW: North Sydney–Mosman (units +2.0 % vs houses –11.6 %), Great Lakes (+14.1 % vs +1.8 %), Canterbury (+8.8 % vs –3.3 %).
- Greater Adelaide: Port Adelaide–West (+24.1 % vs +11.5 %), Prospect–Walkerville (+19.4 % vs +7.0 %).
- Greater Perth: South Perth (+18.2 % vs +9.6 %), Belmont–Victoria Park (+21.5 % vs +16.3 %).
In several of these pockets the median unit is less than half the price of the median house, giving buyers a realistic foothold in desirable suburbs they could no longer reach with a freestanding home.
What happens next?
Inflation remains above the Reserve Bank’s 2–3 per cent target band, keeping the possibility of further rate increases on the table. Any additional tightening would shrink borrowing capacity further and, on current evidence, push more demand toward the more affordable unit segment. KPMG’s August 2026 outlook already expects units to rise modestly in 2026 while houses slip, with units continuing to lead into 2027 on the back of relative value and tighter rental markets.
Longer-term fundamentals still favour property overall — population growth, low vacancy rates and a persistent shortfall of new dwellings relative to underlying demand. But within that picture, the near-term advantage belongs to units. Buyers who need to enter or upsize while keeping repayments manageable are voting with their wallets, and the price data is reflecting that choice.