
SYDNEY, NSW – 22 Aug, 2026 – As a senior property editor tracking Australia’s housing markets closely, the latest data delivers a clear, city-by-city story on supply. The number of homes for sale is rising in the majority of capital cities, giving buyers more choice and shifting negotiating power, while Hobart remains the notable exception with declining stock.
Data from REA Group’s Market Snapshot (July 2026) and SQM Research’s Total Property Listings report paint a consistent picture: total advertised stock has built through the first half of the year and into winter, even as the usual seasonal slowdown in new listings appeared in some markets.
The National Picture
Nationally, SQM Research recorded total property listings rising a strong 12.4% month-on-month in July to 278,984 dwellings — an unseasonal jump for winter. That put national stock 22.8% higher than July 2025, the strongest annual increase in available housing in over a year. Both new listings (+5.1%) and older stock (+8.1%) contributed, a classic sign that properties are taking longer to sell as demand softens.
REA Group data aligns directionally: total homes for sale nationally sit about 4% higher year-on-year, and almost 10% higher across the combined capitals. New listings eased in July (down ~11% month-on-month and 2% year-on-year), driven largely by Sydney and Melbourne, yet the accumulation of existing stock has left buyers with more options than a year ago.
While traditional buyer agents charge $15,000–$40,000+, We evaluate hundreds of key data points — historical sales, listings, location metrics, and land details — to give you confident, high-return buying decisions. Don’t overpay for expertise!
Unlock expert property buying advice report for FREE (real $0). Start your Buyer Brief now!
Capital City Breakdown
Here’s how the capitals stacked up in July 2026 (drawing primarily on SQM total listings and REA year-on-year changes):
- Melbourne: Sharpest rise among the majors. SQM: 50,867 listings (+15.5% MoM, +42.8% YoY). REA notes a more modest ~5% rise in total stock year-on-year. The city’s softer demand and longer selling times have allowed stock to build.
- Brisbane: Strong growth. SQM: 20,273 (+18.0% MoM, +29.5% YoY). REA: ~17.7% higher total listings year-on-year.
- Adelaide: One of the biggest relative increases. SQM: 10,399 (+16.0% MoM, +30.1% YoY). REA: +18.6% year-on-year — the largest among the capitals in their data.
- Sydney: Solid rise despite weaker new-listing flow. SQM: 39,400 (+6.6% MoM, +28.0% YoY). REA: around +8%.
- Perth: Continuing to add supply after a quieter 2025. SQM: 15,218 (+5.5% MoM, +10.0% YoY). REA indicates mid-teens growth in total listings.
- Canberra: Clear increase. SQM: 5,066 (+10.3% MoM, +23.7% YoY). REA: around +17%.
- Darwin: Rising. SQM: 1,082 (+15.6% MoM, +8.5% YoY). Some REA commentary groups it closer to Hobart on the tighter side of total stock.
- Hobart: The clear outlier. REA: 22.6% fewer homes for sale year-on-year in July. SQM: 2,515 listings (+3.8% MoM but still –10.3% YoY). Fewer new listings over an extended period, combined with faster selling times (around 30 days on market), have kept total stock tight.
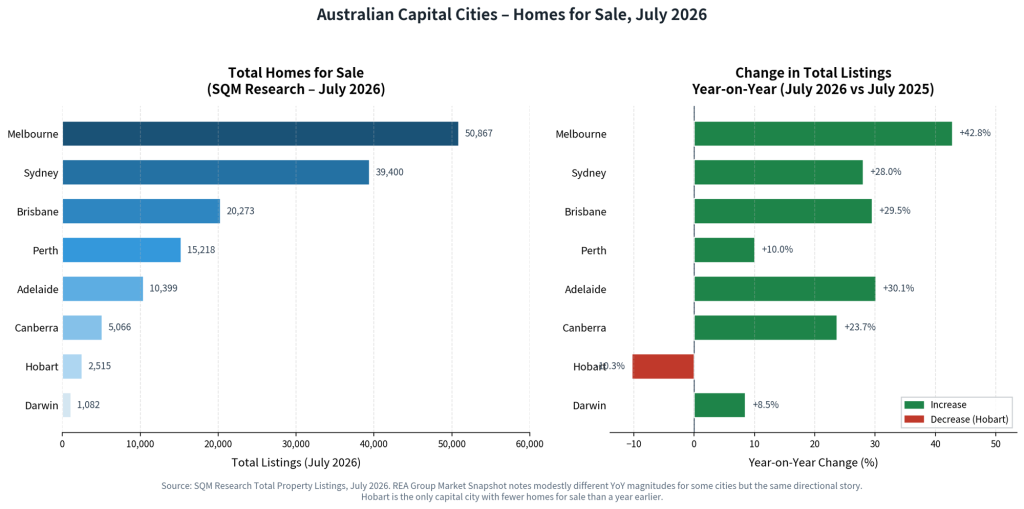
In short: every capital except Hobart has more homes available than a year earlier. The build-up has been most pronounced in Melbourne, Brisbane, Adelaide and Canberra.
Why the Divergence?
Several factors are at play. Softening buyer demand — linked to higher interest rates, cost-of-living pressures and recent tax changes affecting investors — has slowed absorption of listings in the larger cities. New listings have cooled in Sydney and Melbourne in particular, but older stock is lingering.
In Hobart the opposite dynamic is evident: a quieter flow of new listings through much of 2025 and 2026, plus improved days-on-market, has reduced the total pool of available homes. The city’s rental vacancy rate remains extremely tight (0.6%), underscoring ongoing housing shortage pressures on the island.
Agents in Perth, Adelaide and Brisbane report that higher stock levels are finally allowing some long-held upgraders and downsizers to move, after years of extreme tightness. Quality, well-presented homes in good locations still sell relatively quickly and can achieve premiums; average or poorly priced stock faces more competition and longer campaigns.
What It Means for Buyers and Sellers
Buyers in Sydney, Melbourne, Brisbane, Adelaide, Perth and Canberra now enjoy meaningfully more choice than 12 months ago. Negotiating power has improved, vendor discounts are wider in many segments, and the fear-of-missing-out environment of previous years has eased.
Sellers need to be realistic on price and presentation. The market has shifted from a pure sellers’ environment in most capitals. Spring traditionally brings more listings; if that pattern holds, supply could rise further and put additional pressure on prices through the remainder of 2026.
Hobart remains a tighter, more competitive market for buyers, with the supply constraint supporting relative resilience.
Looking Ahead
Cotality and other analysts note that total advertised stock across the combined capitals has moved above five-year averages in recent months, while new listing flows have moderated. Auction volumes remain well below year-ago levels in the two largest cities, with more vendors preferring private treaty.
The trajectory into spring will be critical. A typical seasonal lift in new listings, layered on already higher total stock, would further tilt conditions in favour of buyers in most capitals. Hobart’s tighter dynamics look set to persist unless new listing activity picks up markedly.
The data is clear: the number of homes for sale is rising across the majority of Australia’s capital cities. Only Hobart is moving in the opposite direction. For anyone watching the market — whether buying, selling or investing — that divergence is one of the defining features of the 2026 landscape so far.